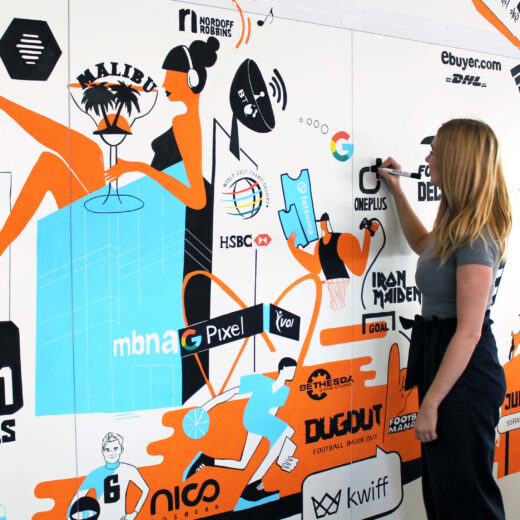
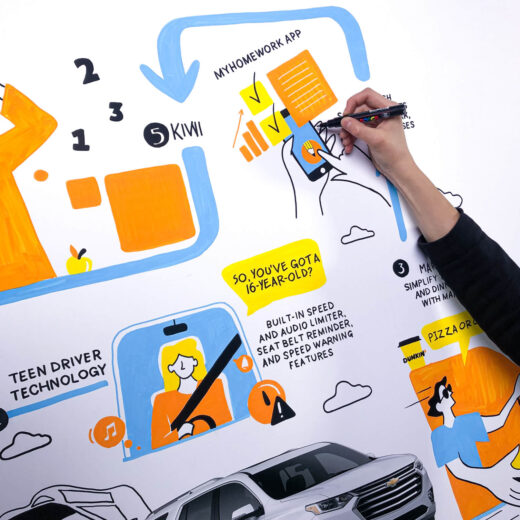
Business Infographic is worth a thousand words.

When you need to convey complex information, words aren’t always enough. Our corporate clients rely on our business infographic designers to do this. But, we cannot do this without building a relationship with you, our client. We see the Business Infographic process as a collaborative effort that helps us find the right tone for your business. We specialize in finding the right fit for your brand and offer creative insights using Rich Picture method to help you create visuals that solve problems.

We design Infographics for business using sketches that helps explain topics and show linkages between ideas. This process is strategic and analytical and helps to get to the very core of the content and create effective outcomes.
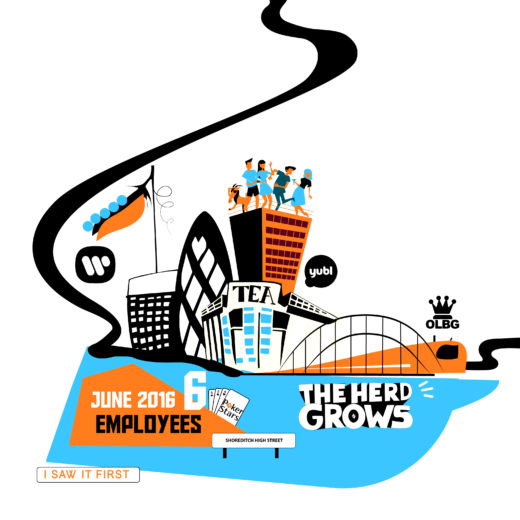
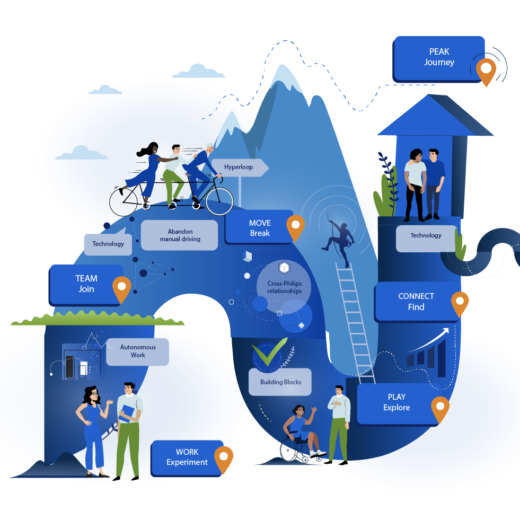
Infographic for business

Rich
Picture

Rich Picture design is a method we use to create Business Infographics at Smartup Visuals. It is a way of visualising complex information through sketches, schemes, diagrams. It can be thought of as a sketch of ideas and messages to show links and connections. Rich Pictures come first, and then Infographics follow.

Illustrations are our twist on business business infographics. In order to make infographics look more lively and human, we use more pictures than graphs. Visual storytelling is about depicting a topic and telling a story that inspires and engages the audience. Audiences respond well to visual storytelling. This is why so many businesses choose Infographic designers to help them communicate their ideas. But if you prefer moving visuals, take a look at our animations.

Why you company should use Business Infographics?

01

People consume visuals with pleasure.

Visual representation helps when information too difficult to consume on it’s own.

02

Visual storytelling builds emotional connection.

Business infographics connect ideas through visual stories, which build emotional connections with your viewers.

03

Infographics help business communicate things better

Infographics help explain complex content and overcome its complexity.

Infographic
Illustration

A business infographic is a piece of information or data illustrated so that your target audiences can instantly engage and grasp the content and messages you are trying to convey. In this way, you present the ideas in the most effective way and maintain engagement with your audience.

Our infographic designers can work in a range of styles. And if you struggle to envision what you are looking for will help you to choose something that will feel ‘on brand’ with your business and have the best look for the project you have in mind. We cooperate with our clients to find the right look and tone to fit with a company’s ethos.

We’ve worked creating strategy illustrations for corporate clients, branding materials, rich pictures, and strategy visualisation Graphic Recordings. We capture essential information accurately, communicate it effectively, and open a discussion across organisations as a result. We will assist you throughout the whole process if you decide to hire our Infographic designers.

Suppose you are interested in infographics created Live. Please have a look at our Live Scribing Service.


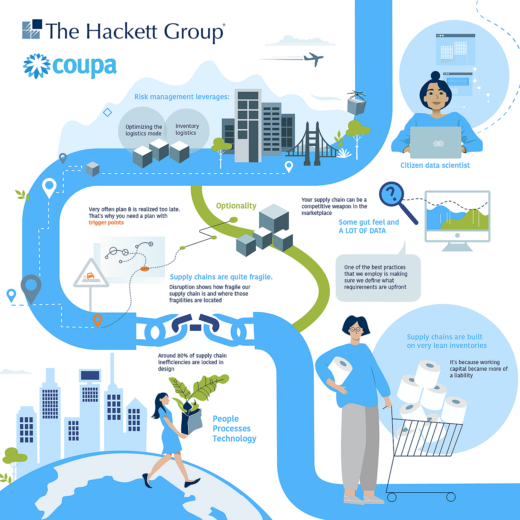
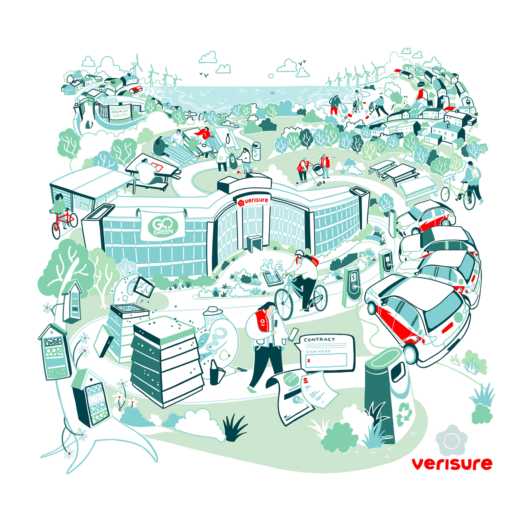
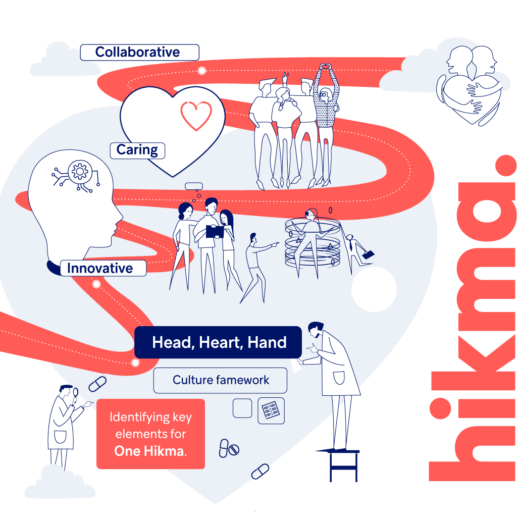
Infographic illustration example


Business Infographics FAQ
Business infographics: what types are there?

Business infographics typically include:

  • Informative infographics
  • Process infographics
  • Graphical maps 
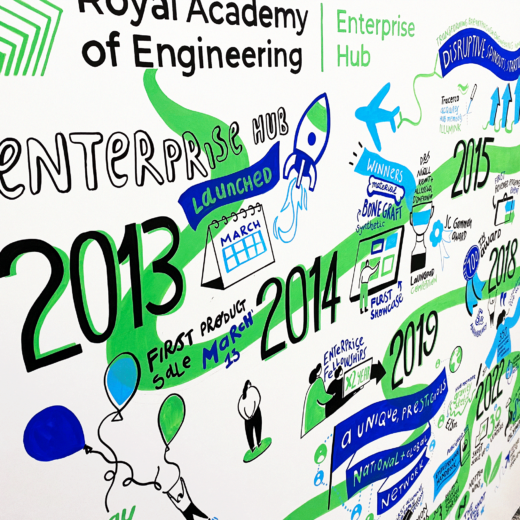
  • Infographics of a company’s journey or vision
  • Business Timeline infographics 

We at Smartup Visuals create Illustration Infographics through the use of rich illustrative vector illustrations that compliment the geometric shapes and data in an infographic. 

What are infographics used for?

During the information age, infographics gained popularity. The result was that people began to seek more effective ways to present information.

We use illustrations, for example, to visually communicate a single message. From the Rich Picture – planning and drawing on paper by hand – we start the whole process. Seeing connections between ideas creates a bigger picture.

A business infographic is the result of a Rich Picture. Once we have brainstormed, analysed and segmented the data on paper, we move on to our laptops and design infographics. Rather than only using typography, graphs, and numbers to illustrate data, we use illustrations to capture key messages and enrich the infographic.